Use the Decarbonization Planner to see whether your planned projects could reach your emissions reduction target. You can compare different plans, review costs and supporting evidence, and download a PDF roadmap.
Hydrus calls each plan a scenario and each project in it a lever. For example, one scenario might include rooftop solar and a switch to electric vehicles.
Check your target
- Under Sustainability in the sidebar, open Decarbonization.
- Check the baseline year, target year, scopes, and source calculation at the top of the page. The baseline is the emissions amount your plan starts from.
- Check the target percentage and year. The planner uses the most recently created target, even if you have other active targets.
If you see No target set yet, select suggest a starting target to open the Targets page. Follow How to set and replace an emissions reduction target before building your plan.
Needs inventory means there are no emissions calculations yet.
Create a plan
Select new scenario, then choose how to start:
- Draft a starting roadmap with AI: Hydrus adds five suggested levers based on your largest emissions sources. You can name the scenario or leave the name blank to use “AI-drafted starting roadmap.”
- Start empty: Name the scenario and add the projects yourself.
You can create one AI-drafted roadmap per target. If Hydrus cannot find suitable levers, it asks you to upload more activity data.
Select a scenario in the Scenarios card to open it. Each one shows how many levers it contains. Use duplicate to copy the selected scenario, or compare to show two or more scenarios on the same chart.
The trash icon deletes the selected scenario immediately, without asking you to confirm.
Add a project
You can choose a lever from the library or enter your own project.
Choose from the library
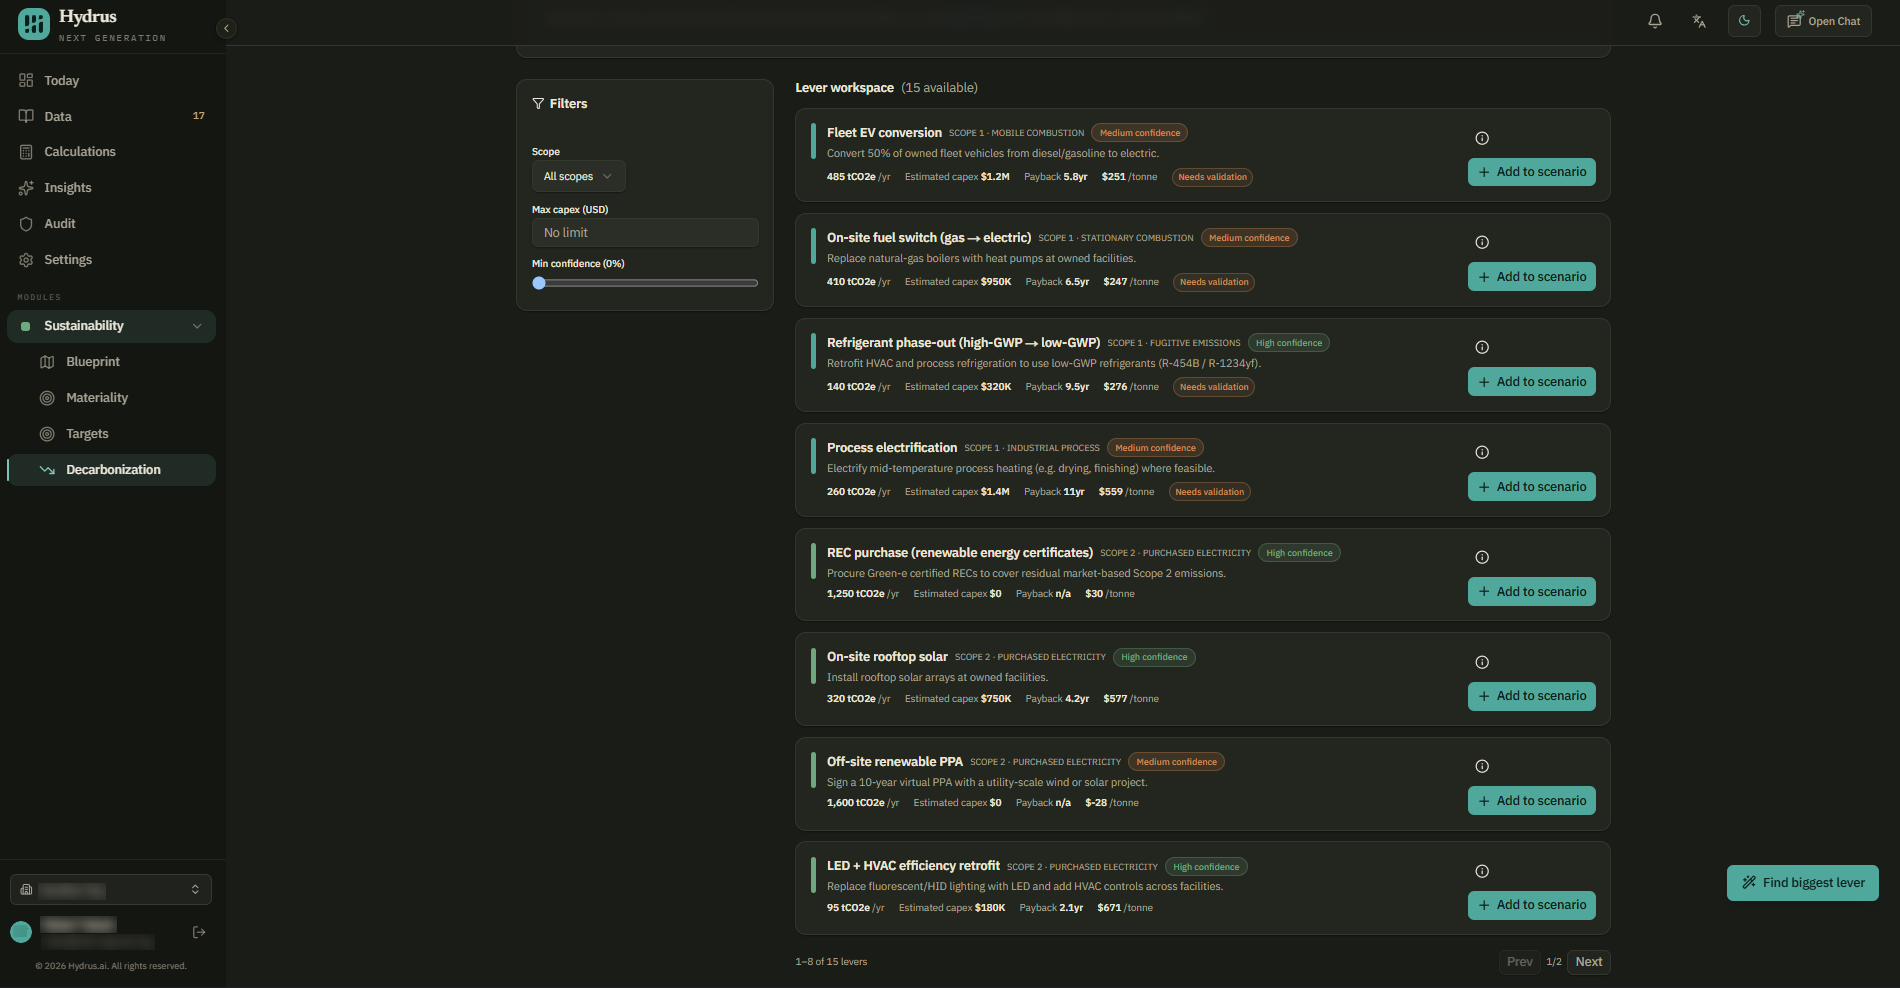
- Find a project in the Lever workspace. Use scope, max capex, and min confidence to narrow the list. Capex means the upfront cost.
- Review its yearly reduction, upfront cost, payback period, cost per tonne, and confidence level.
- Select the info icon to read the assumptions and sources behind the estimates.
- Select add to scenario. The lever starts counting reductions from next year.
Enter your own project
Select add a lever and complete the four steps:
- Basics: Enter a name, scope, what will change, and the start year. To start with estimates from a similar initiative, select it and choose use these numbers.
- Impact: Enter the yearly emissions reduction in tonnes and explain how you estimated it.
- Cost: Enter the upfront cost, yearly operating cost (opex), and payback period. Enter savings as a negative operating cost. Leave payback at 0 if the project will not pay for itself.
- Evidence & review: Choose a confidence level, add the source, and explain why you chose that level.
Confirm or change every value marked AI suggested · confirm before moving to the next step.
The final step shows how much the project reduces the gap to your target. Select add lever to scenario to save it.
Check each project's estimates
Open the project in Scenario levers. Its label tells you where the estimates came from:
| Label | Meaning |
|---|---|
| Inventory-backed | Hydrus matched the lever to an emissions source in your calculation. |
| Needs validation | The estimates came from a general template or were entered by hand. |
Review the four evidence cards: Source, Reduction basis, Cost basis, and Confidence. They should explain where the estimates came from and why you expect the project to deliver them. An empty card prompts you to add an evidence note.
To change the yearly reduction, upfront cost, yearly operating cost, or start year, select edit assumptions. Changes save as you type.
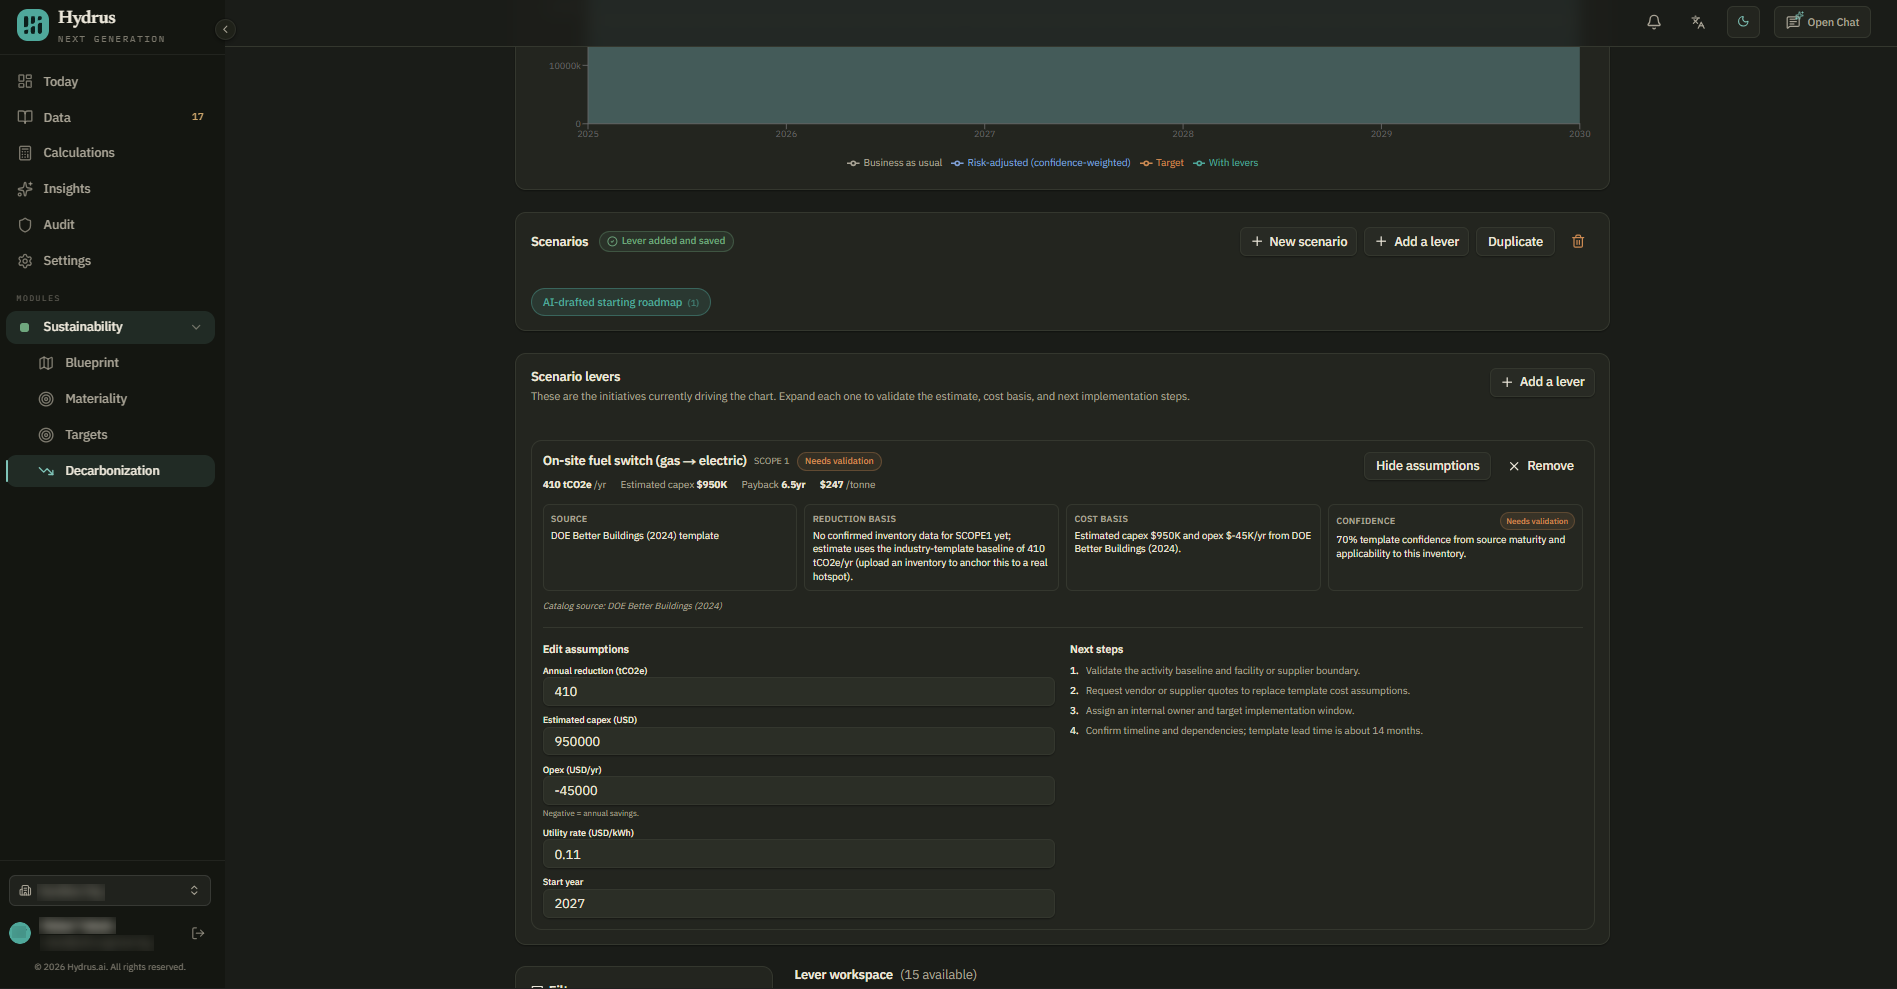
Also check the warnings above the chart. They flag issues such as projects that start after the target year, reductions larger than the baseline, and levers that still need validation.
See whether the plan reaches your target
The Emissions trajectory vs target chart shows emissions from the baseline year to the target year.
| Line | What it shows |
|---|---|
| Business as usual | Emissions stay at the baseline amount. |
| With levers | Emissions fall by each project's estimated yearly reduction, starting in its start year. |
| Risk-adjusted (confidence-weighted) | Reductions are scaled by confidence. At 50% confidence, a project counts for half its estimated reduction. |
| Target | A dashed line showing the emissions level you want to reach. |
Above the chart, check whether the scenario Hits target or has a gap remaining in the final year. The other figures show the total tonnes avoided over the plan and the estimated upfront cost.
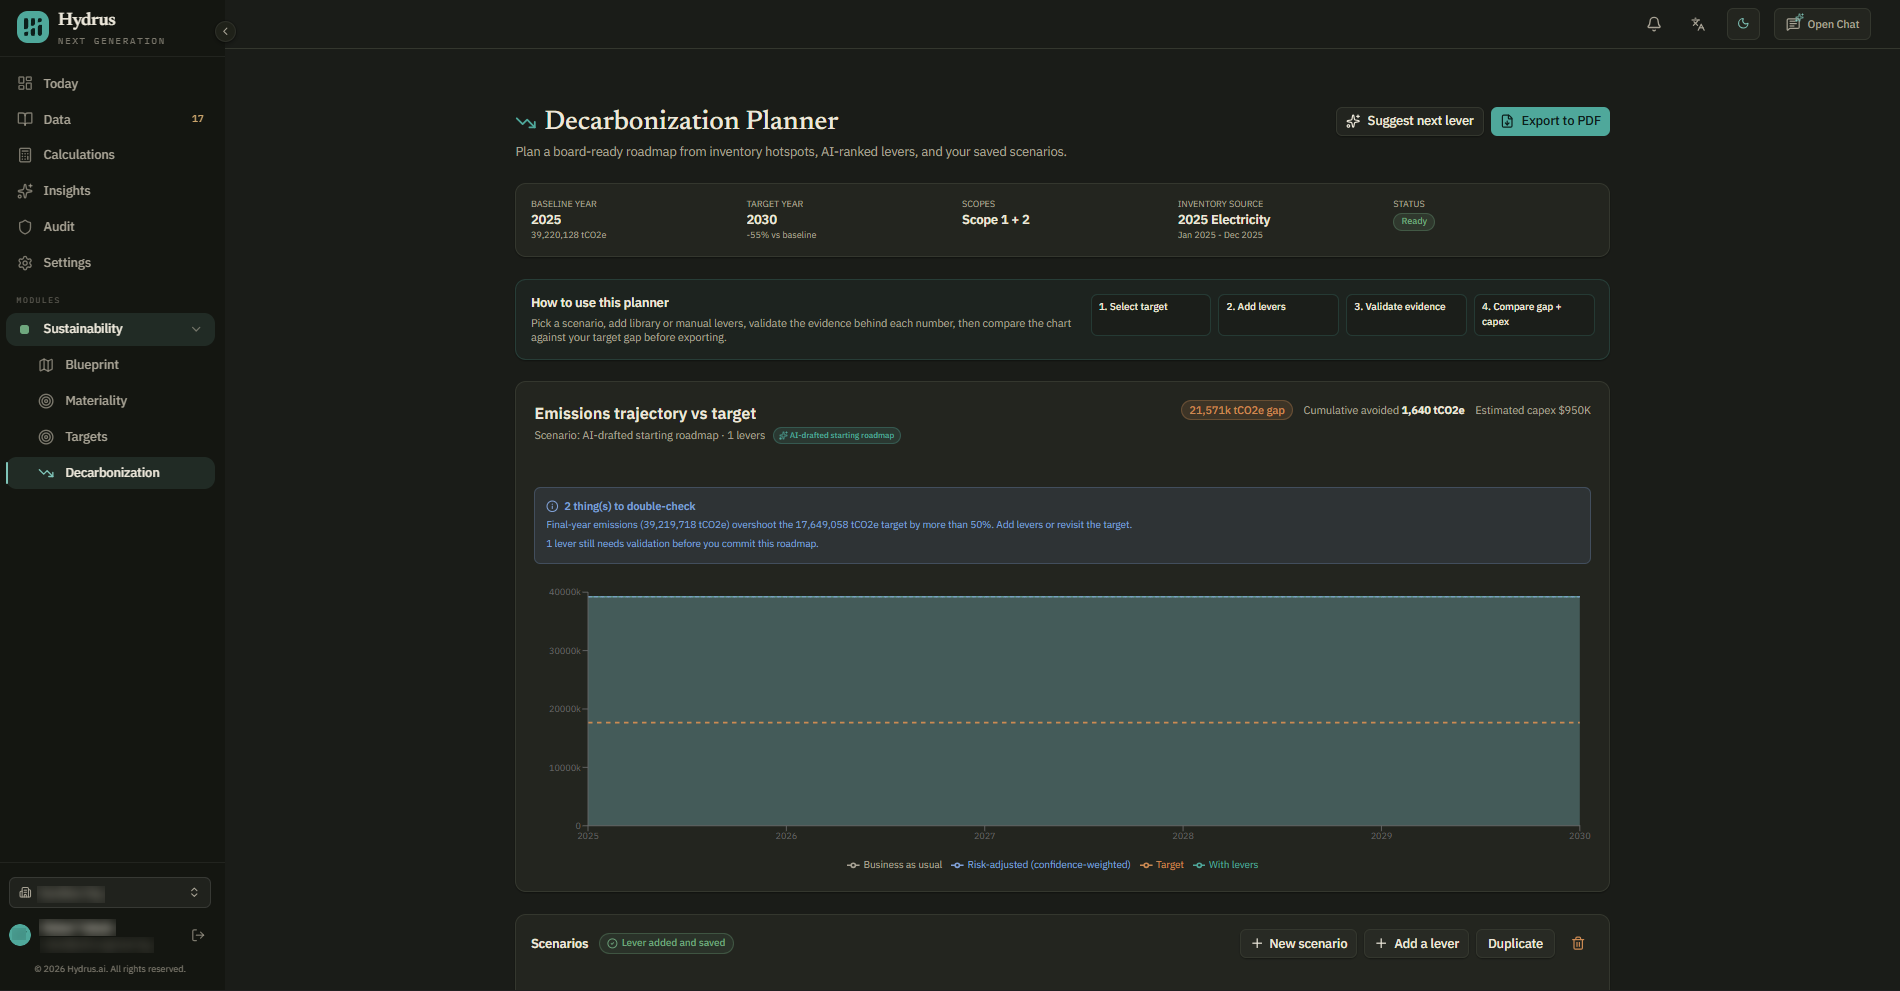
If With levers reaches the target but Risk-adjusted does not, the plan depends on reductions beyond the confidence-weighted estimate. Review the projects with lower confidence before relying on the plan.
Check what the chart assumes
- Projects deliver their full yearly reduction from the start year. The planner does not gradually increase their impact. Choose a start year that reflects when the project will reach its full effect.
- Project reductions are added together. If two projects reduce the same emissions, adjust or remove one to avoid counting the reduction twice. For example, rooftop solar and renewable energy certificates may cover the same electricity use.
- Project estimates stay the same when the baseline or target changes. The chart and gap update, but you need to review the lever estimates yourself.
Export your roadmap
- Select a scenario with at least one lever.
- Select export to PDF.
- Review the scenario, target, yearly reduction, upfront cost, and remaining gap in the preview.
- Select generate PDF to download the report.
The PDF includes a cover page, summary, lever table, year-by-year emissions figures, assumptions, and an analysis of the remaining gap. It does not include the trajectory chart. If you need that chart in your presentation, capture it from the planner separately.
Before sharing, check that the roadmap uses the intended target, explains its costs and estimates, and does not count any reduction twice. Review any remaining validation warnings and the risk-adjusted result.
Access and change history
Everyone in your organization can view the planner and its scenarios. Creating, changing, and deleting scenarios and levers is recorded in the audit trail, with links back to the scenario.