A custom report is a report you build for a particular question or audience. It could be a two-page summary for your board, emissions by facility for a lender, or one year of electricity data for a colleague.
A framework report follows a set of reporting questions or topics, such as those used for CSRD, CDP or GRI reporting. Use a custom report when you need to choose the information and layout yourself.
Custom reports start from your data sheets and calculations, so you don't have to copy numbers into a separate document. A data sheet is a table of records, such as electricity use; a calculation uses source data to work out a result, such as emissions for a year.
There are two kinds of custom report:
| Report type | Use it when | What you get |
|---|---|---|
| Data extract | You need numbers pulled together and grouped in a table. | A table with totals, plus CSV and XLSX downloads. |
| Narrative document | You need a written report that explains the results. | A report made of titled sections, plus a PDF download. |
CSV means comma-separated values, a plain text table; XLSX is an Excel workbook. Both can be opened in spreadsheet software. PDF is a document format for reading and sharing.
If you need a CSRD, CDP, GRI, or similar report, use the framework process instead. See how to create, file, and export a sustainability report.
Start a custom report
-
Open the Insights page.
-
Select the Reports tab.
-
Select the create report button.
next.hydrus.ai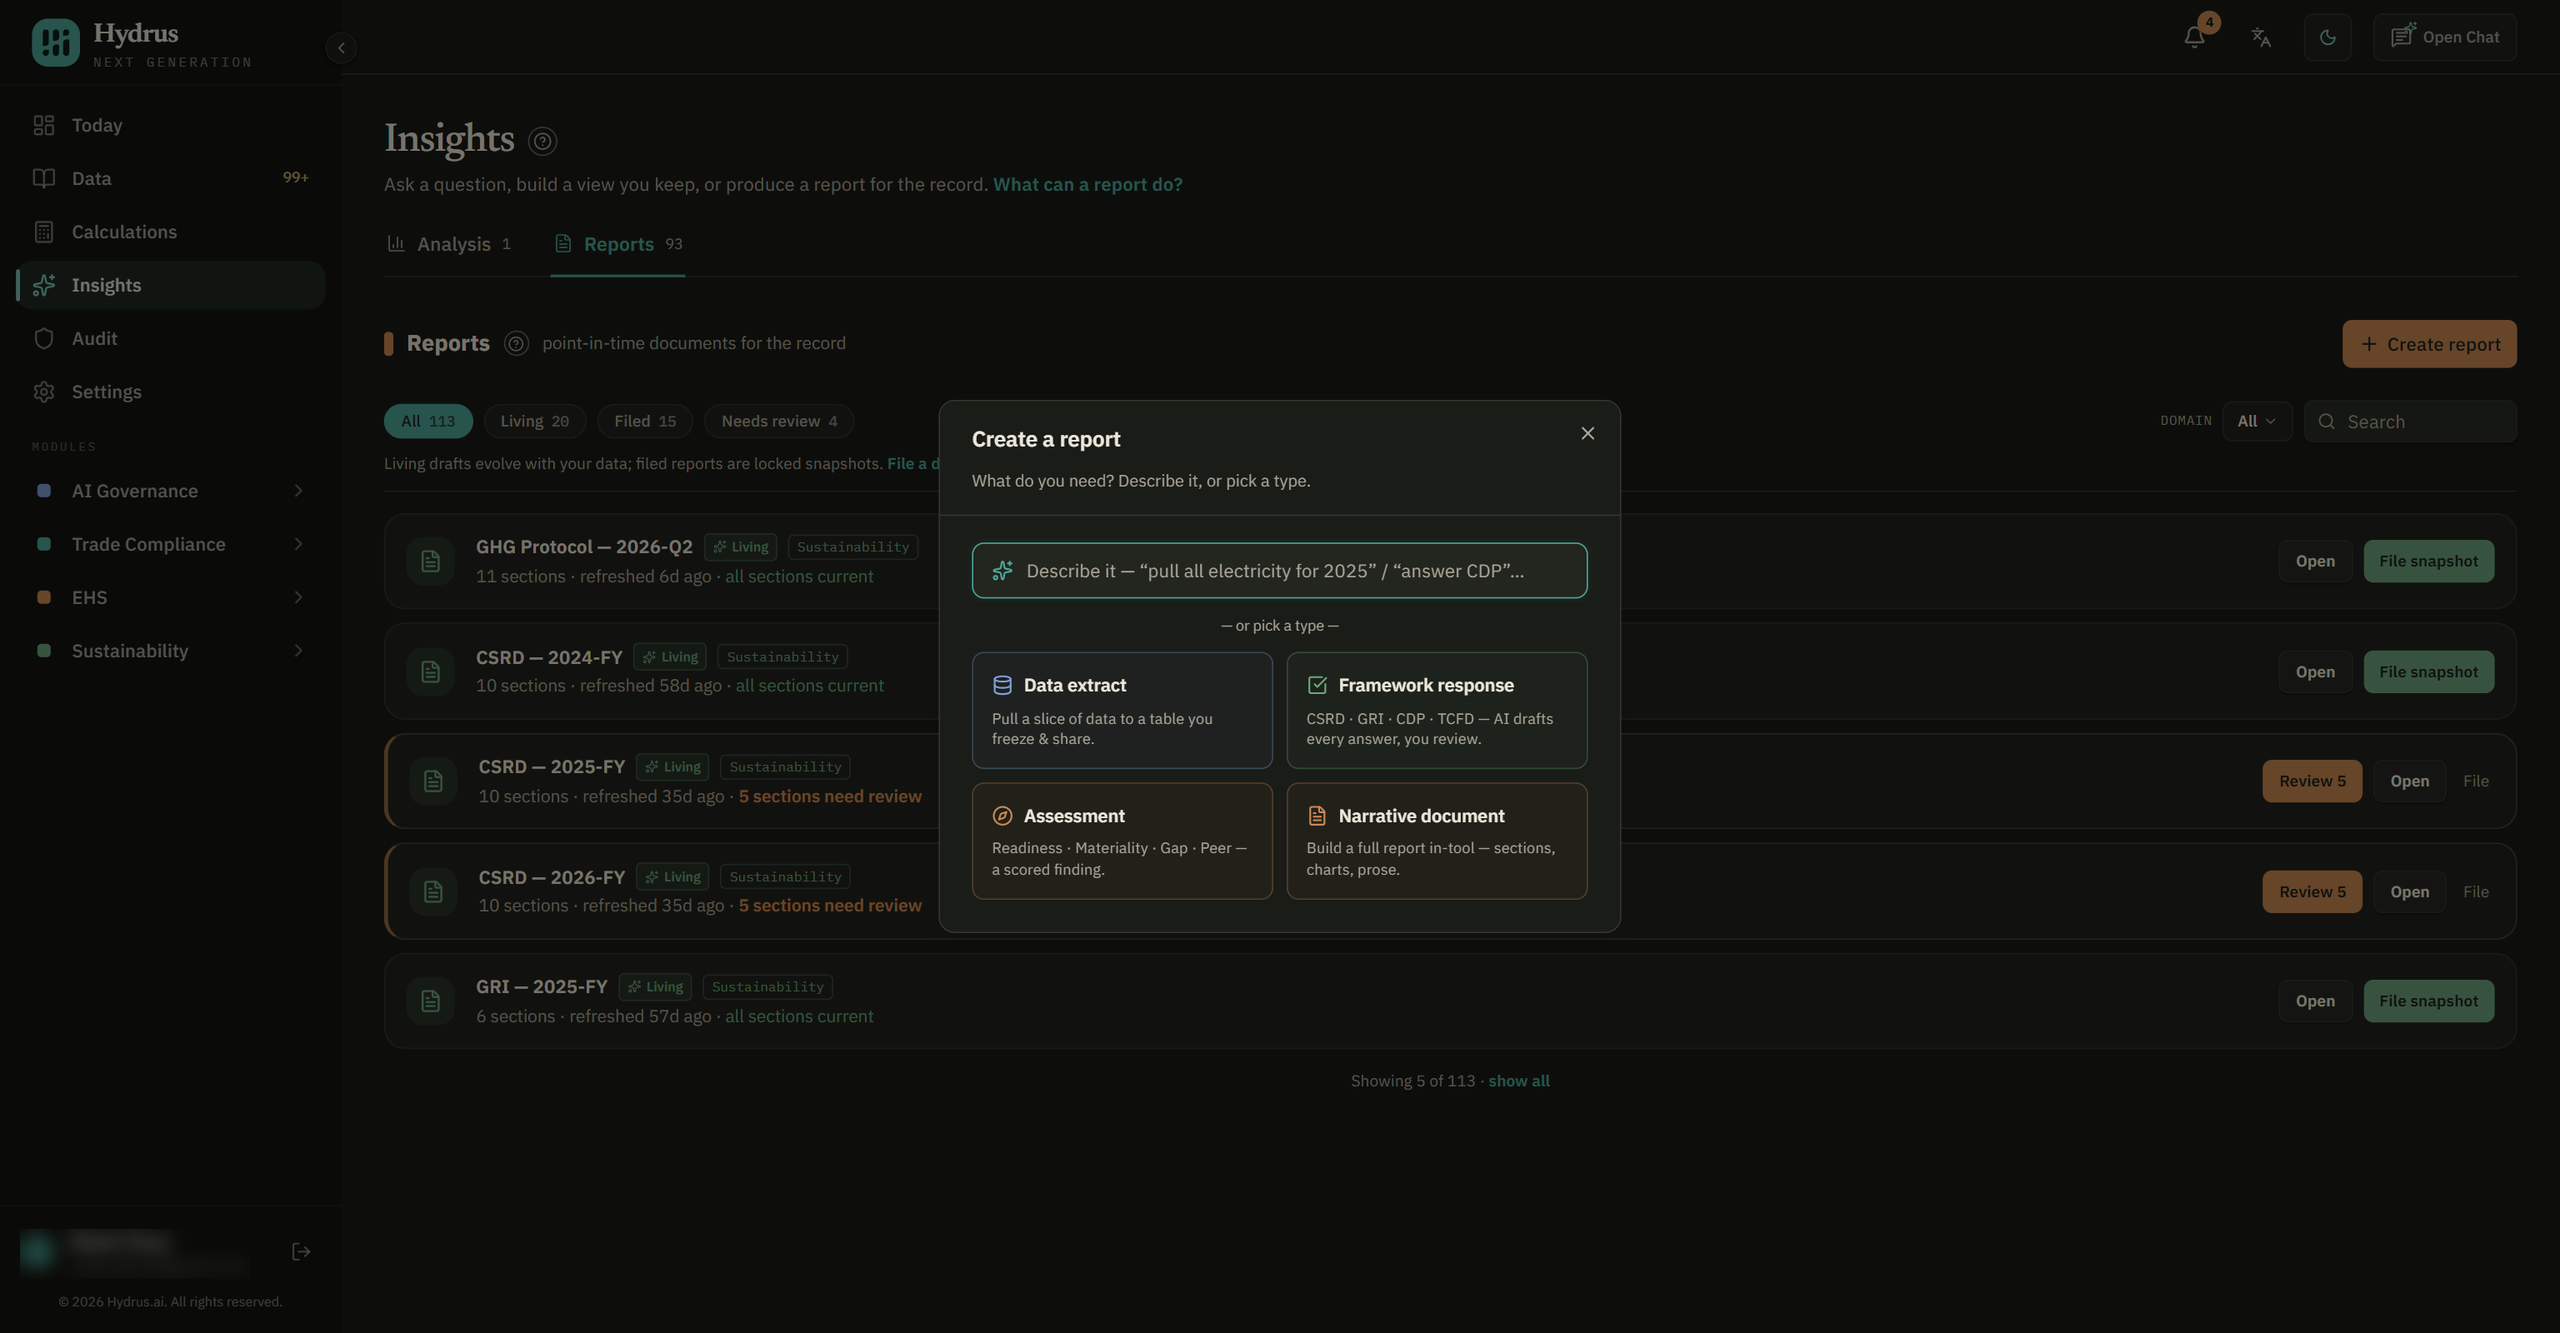
-
Select the data extract card or the narrative document card.
You can also type your request into the box at the top of the window. A request that uses a word such as "pull", "export", or "list" opens the data extract, with your words already in the instructions. A request that names a framework opens that framework's report instead. Anything else runs as a question on the Analysis tab.
Build a data extract
The data extract card opens the Custom Report window. The period is the time your report covers, such as a year.
-
Enter a name in the report title field and a value in the period field.
-
Describe the table you need in the instructions field.
-
Under Library sources, select one or more data sheets or calculations. Use the search box if your list is long.
-
Select the preview structure button.
next.hydrus.ai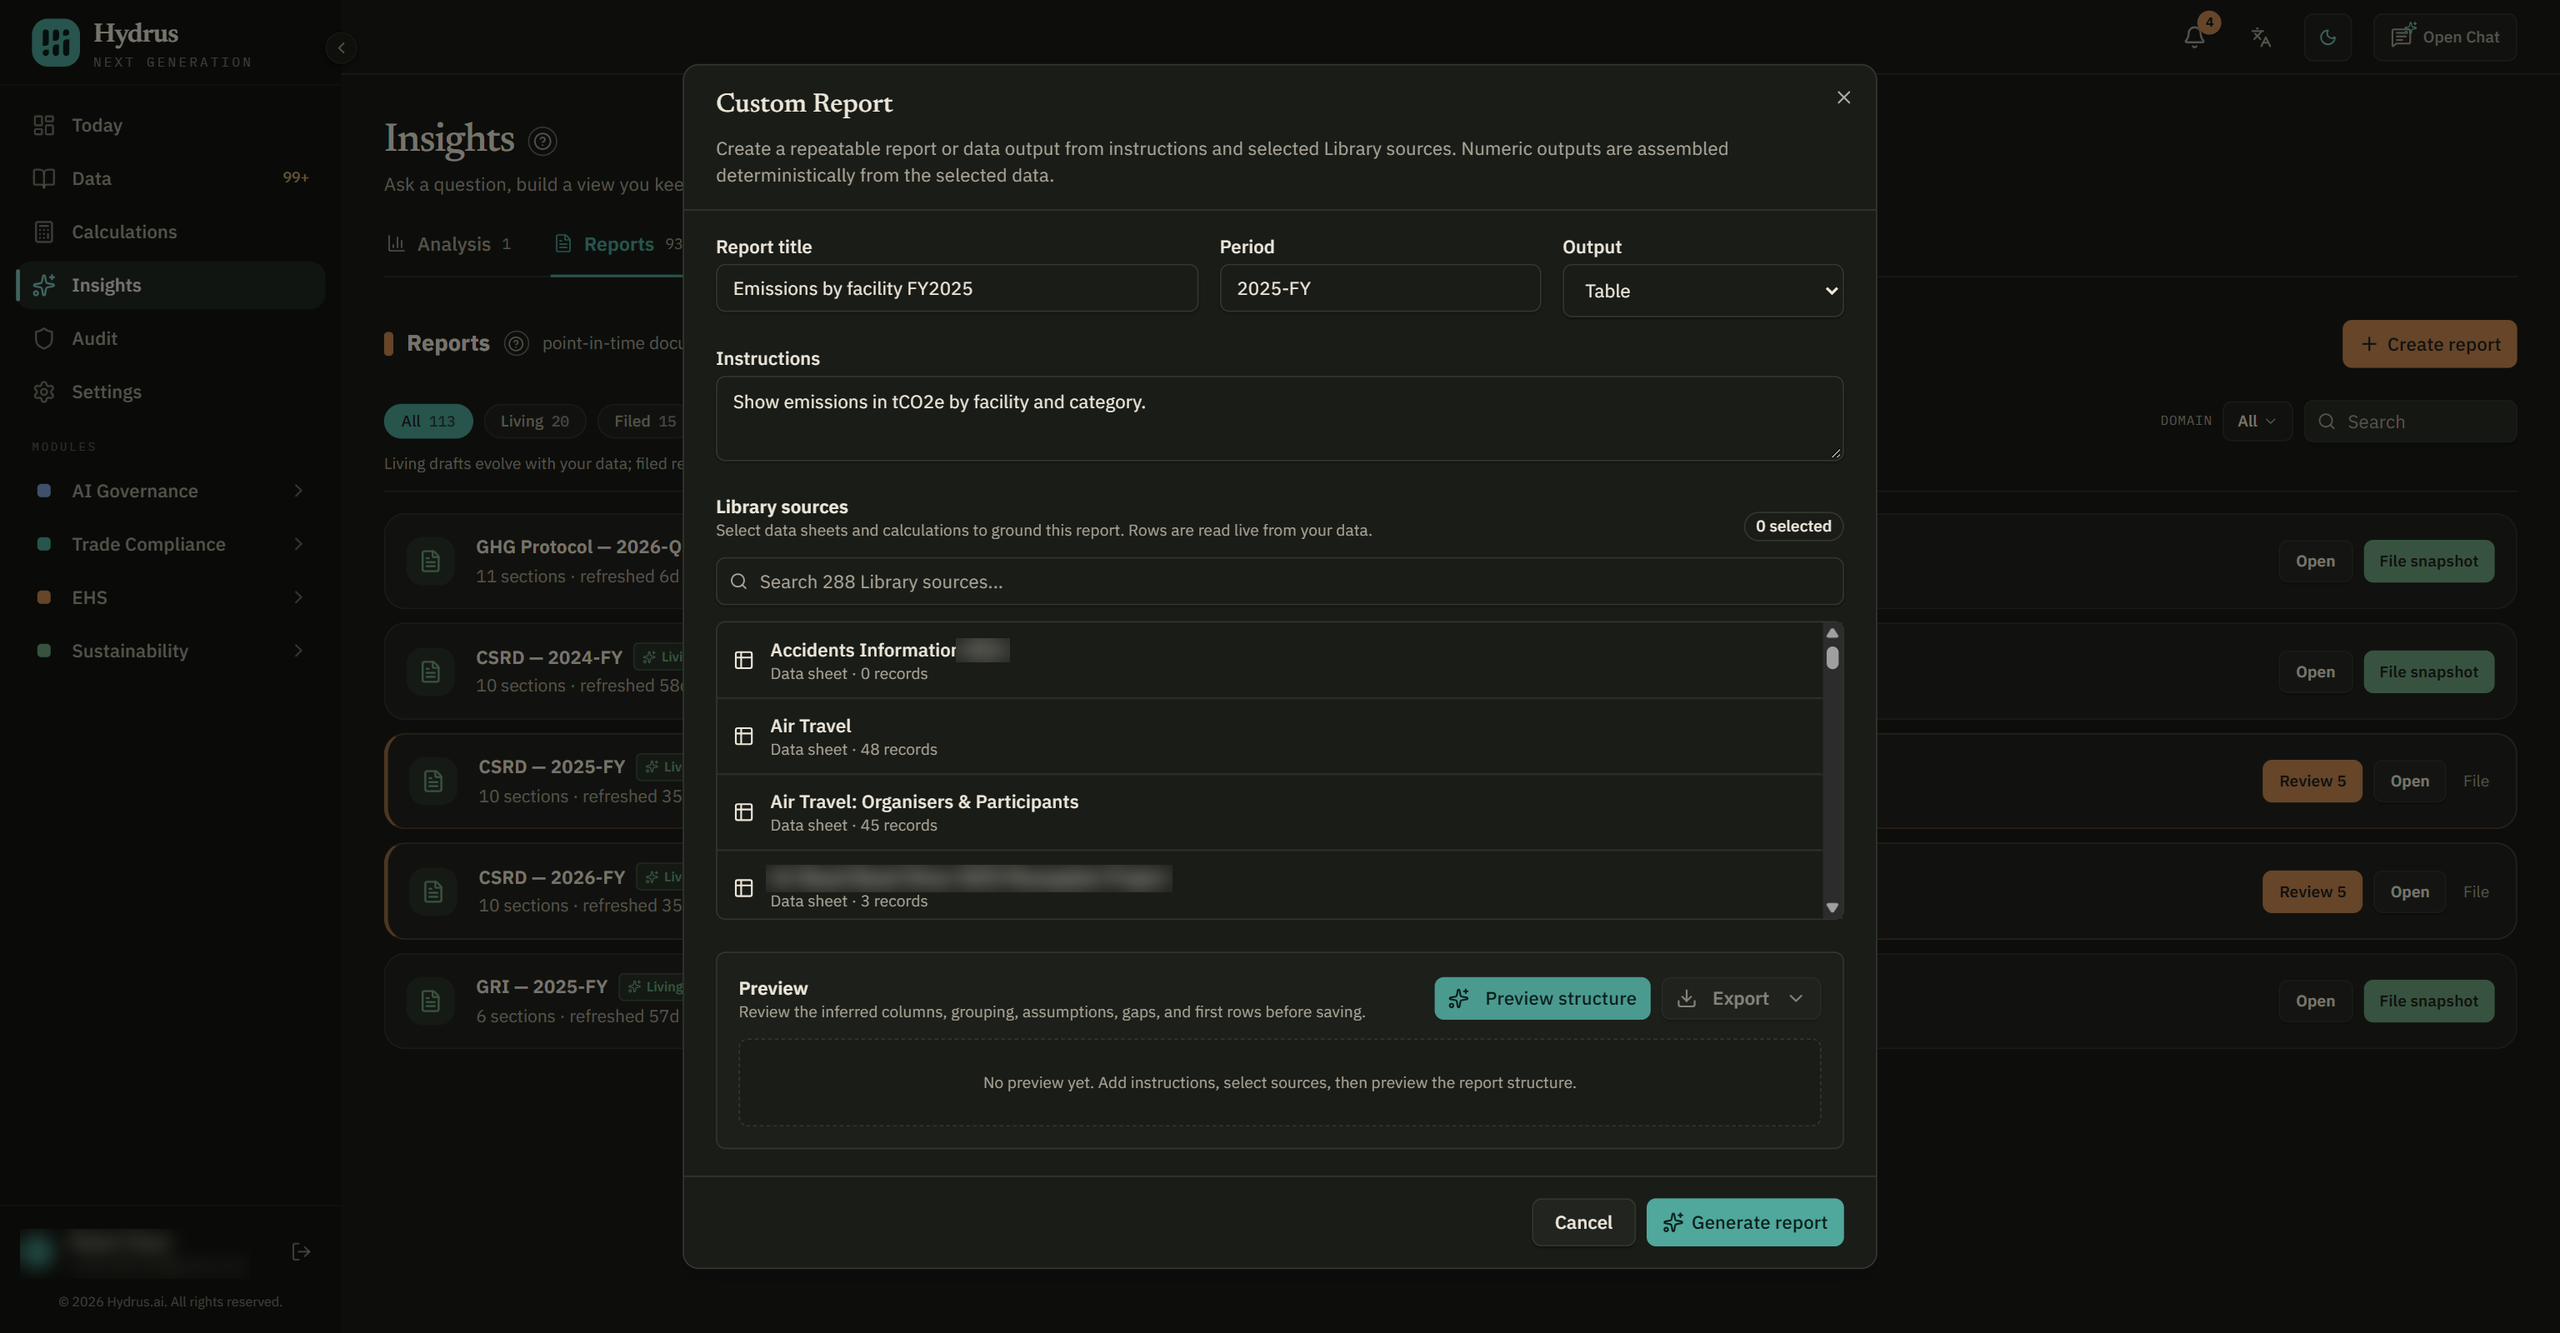
-
Check the preview as described below, then select the generate report button.
Hydrus adds up the numbers from the rows in your selected sources. Your instructions decide how the table is laid out. They don't change the values.
Write clear instructions
Three things in your instructions change the table:
- Grouping: mention region, facility, or category to group the rows that way. You can name more than one.
- A single total: ask for a total without asking for a breakdown, and the table collapses to one row.
- Units: include "emissions" or "tCO2e" when you're working with emissions. Hydrus then converts values recorded in kilograms to tonnes.
tCO2e means tonnes of carbon dioxide equivalent, a unit used to express different greenhouse gases on the same scale.
For example: "Show emissions in tCO2e by facility and category."
If you don't mention a grouping, Hydrus picks one that exists in your data.
Choose your sources carefully
Instructions don't remove rows. Asking for "Canada only" or "electricity only" won't filter the table, so choose sources that hold just the data you need.
The same applies to the period. The period field labels the report, but it doesn't leave out other periods. If a data sheet holds three years of records, all three years count toward the total. To report on one year, select a calculation for that year. Otherwise, the report could show a total for a different period from the one in its label.
Hydrus reads up to 5,000 rows from each source. Rejected records are left out.
Check the preview
The preview shows the number of rows, the grouping, the number of columns, and the first rows of the table.
Check the review items above the table. They point out problems such as:
- Rows missing a facility, region, or category.
- Emissions rows without a Scope 1, 2, or 3 classification.
- Rows in more than one unit, such as kWh and MWh, that were added together without being converted.
Scopes group emissions by where they come from: Scope 1 covers sources your company owns or controls, Scope 2 covers purchased energy, and Scope 3 covers other indirect emissions, such as those from suppliers.
The units warning matters most. kWh and MWh measure electricity at different scales, so adding them without conversion gives the wrong total. If you see this warning, the total isn't reliable until the units are fixed in the data sheet.
Download the rows without saving
Sometimes you only need the data. Use the export button, then download CSV or download XLSX.
This file holds every underlying record from your sources, not the grouped table. It's useful when a reviewer asks to see the rows behind a total. Nothing is saved as a report.
Write a narrative document
The narrative document card opens the New custom report page. You can use AI to draft the written sections, then review and edit them.
The draft uses your calculations and facilities. If a figure isn't in your data, the section shows N/A, meaning no figure is available, with a note to follow up. Search for N/A before saving, then add the figure or remove the sentence.
-
Enter a name in the report title field. The period field is optional.
-
Under Draft with AI, describe the report. For example: "A summary for our board of our latest emissions by scope, which facilities are included, and how the figures were calculated."
-
Select the replace sections button to start from the draft, or the append sections button to add the draft after your existing sections.
next.hydrus.ai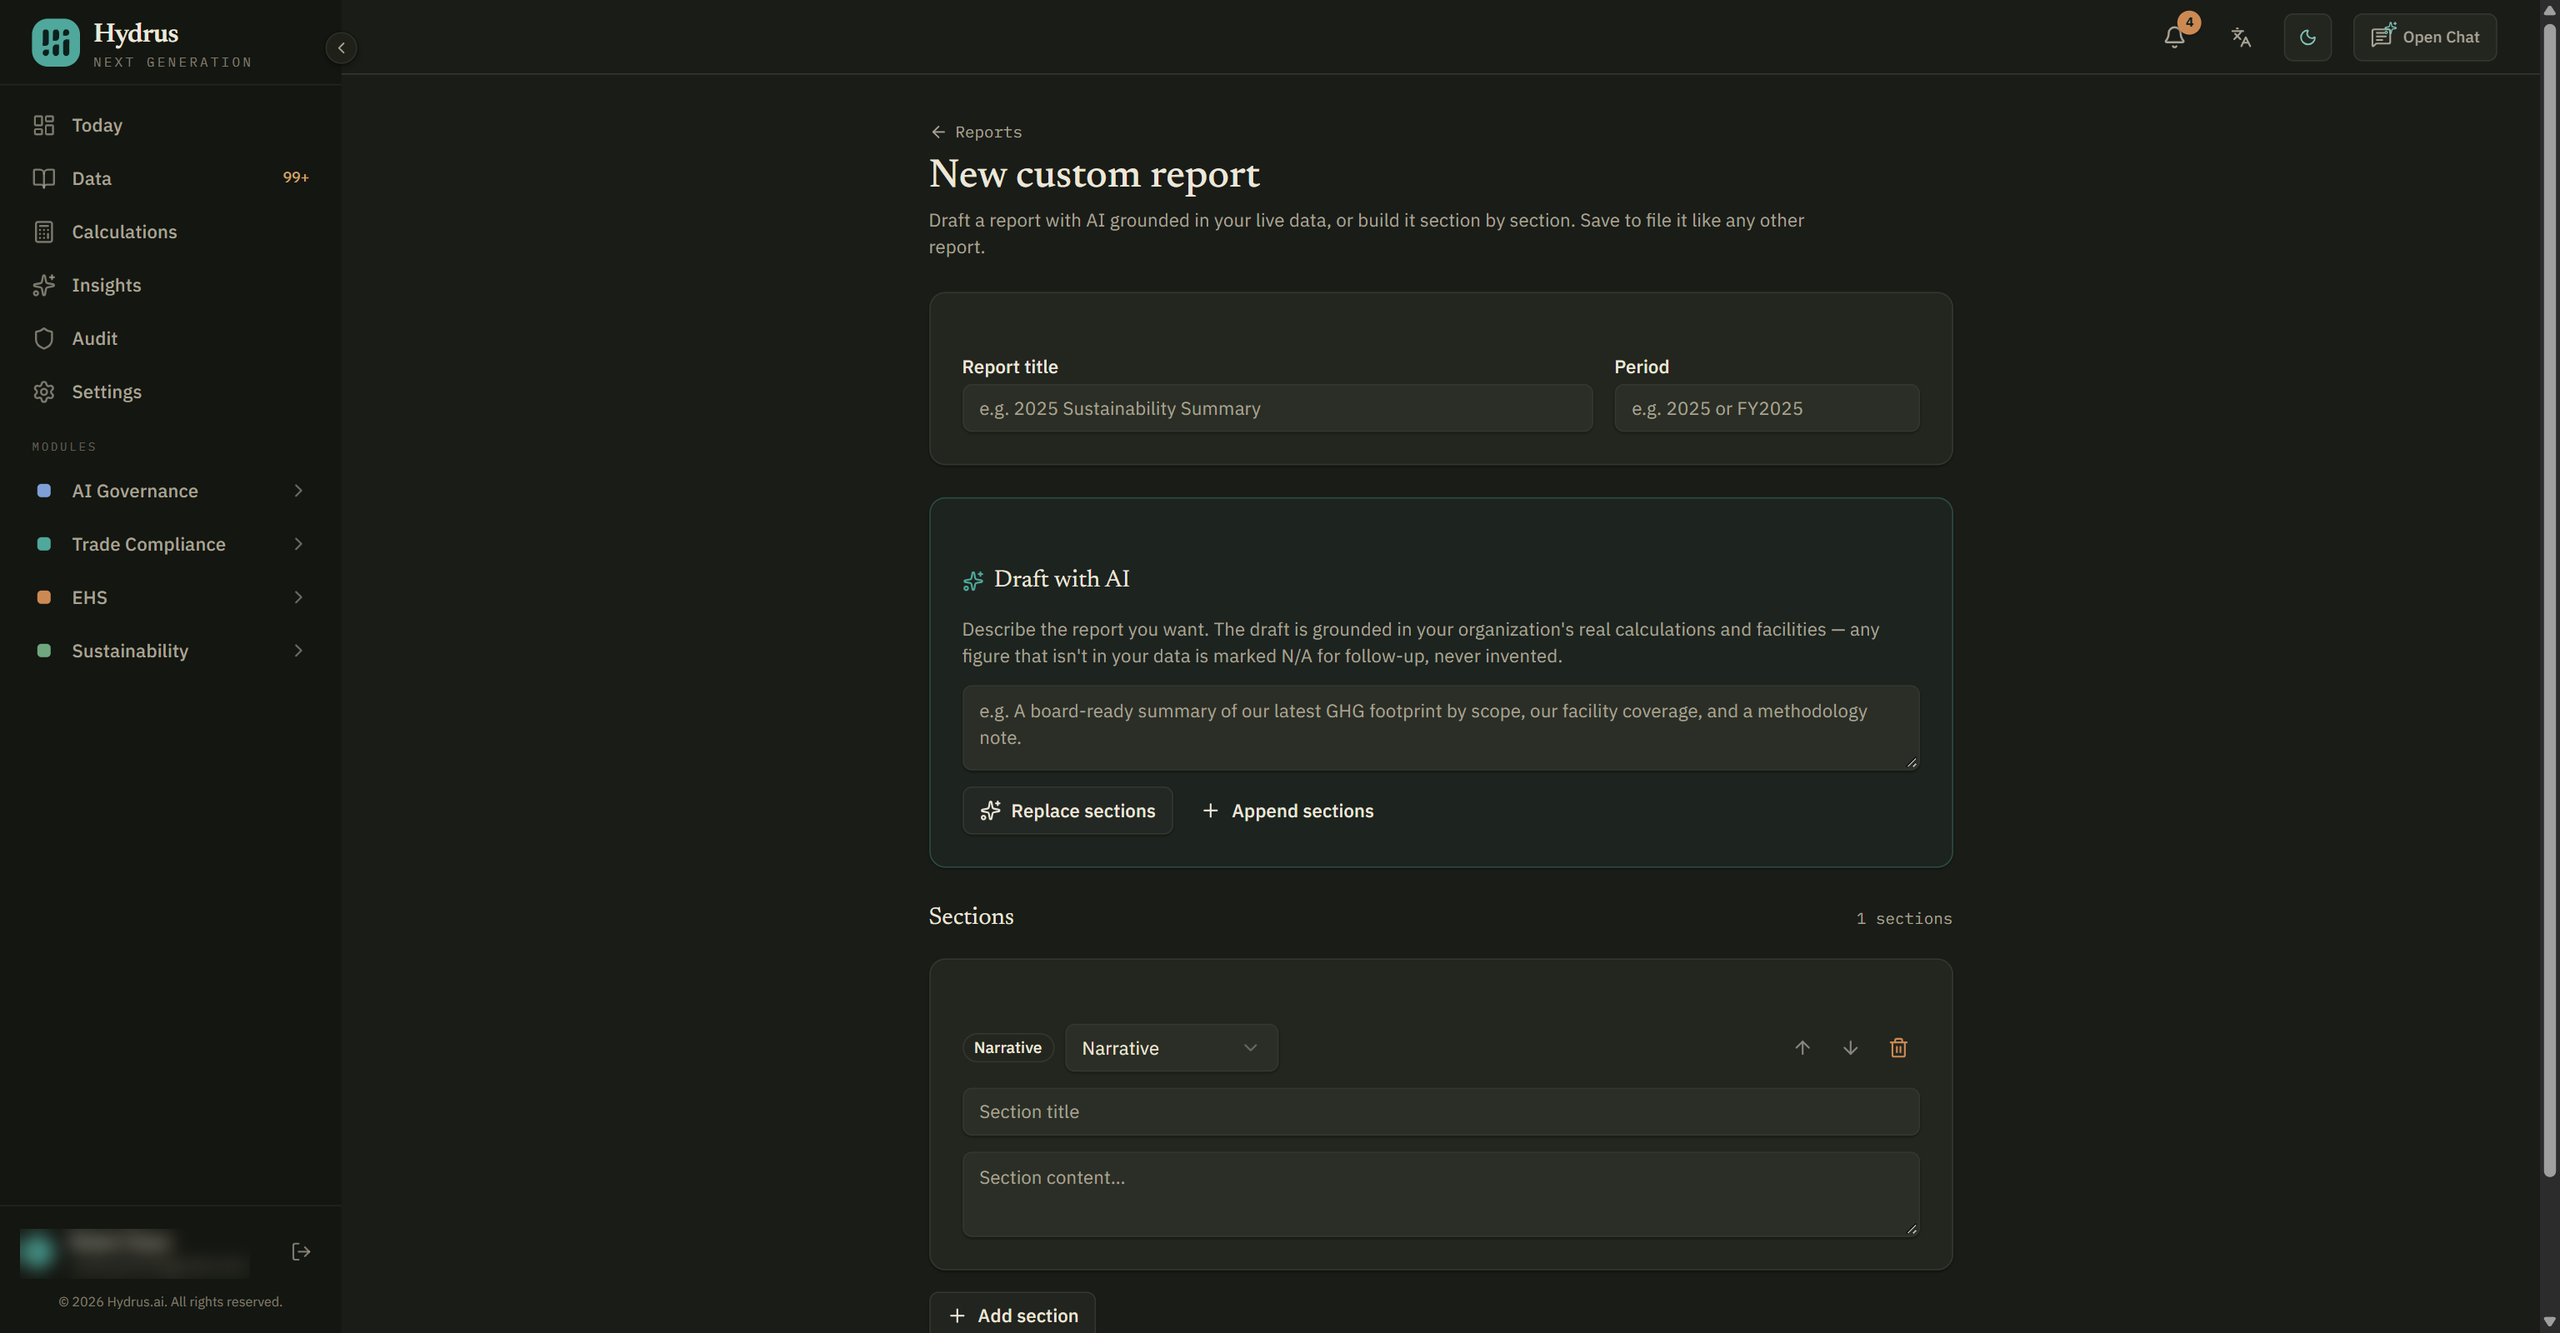
-
Read and edit each section.
-
Select the save report button.
You can also skip the draft and write the sections yourself. Use the add section button for each new one.
Each section has a type: narrative, metric table, chart, or methodology. A metric table lists key figures; methodology explains how the figures were calculated. Use the arrow buttons to reorder sections.
Two things to watch for:
- A section needs a title to be saved. A section with text but no title is dropped when you save.
- A chart section is saved as written text. It describes the chart rather than drawing one.
Open and download the report
The saved report opens straight away. You can find it later on the Reports tab, with the draft label. Select the view button to open it.
From the report, you can:
- Select the download PDF button.
- Select the CSV or XLSX button, if the report contains a table. These files hold the grouped table.
- Select the replay timeline link to see the report's history.
A data extract also records how it was built. The Output definition section lists your instructions, the grouping, the columns, and the assumptions used. The Gaps and review items section lists any problems Hydrus found. On screen, the table shows its first 50 rows. The CSV and XLSX files hold all of them.
A saved custom report doesn't update when your data changes, and you can't edit it afterward. To make a change, create a new report and use the archive button to remove the old one.
Who can use this
Admins and Editors can create and archive custom reports. Other roles don't see the create report button.
Creating a custom report is recorded in the audit trail, the history of actions taken in Hydrus. This lets a reviewer trace how the report was created. See how to trace a reported number with the audit trail.
Before you share a custom report
Before sending a custom report, you should be able to answer:
- Which sources does it use?
- Do those sources hold only the period you're reporting on?
- Are the units consistent?
- Have the review items been dealt with?
- Is every N/A resolved?
These checks help readers trace the report back to your data and understand what it includes.